
Start With the Logs You Have
For a prototype you watch yourself, ordinary request logs are enough, because you read every answer as it comes back. Dedicated monitoring starts to matter on the day the feature is live and you stop reading. From then on, the question is how you'd find out that it had gone wrong.
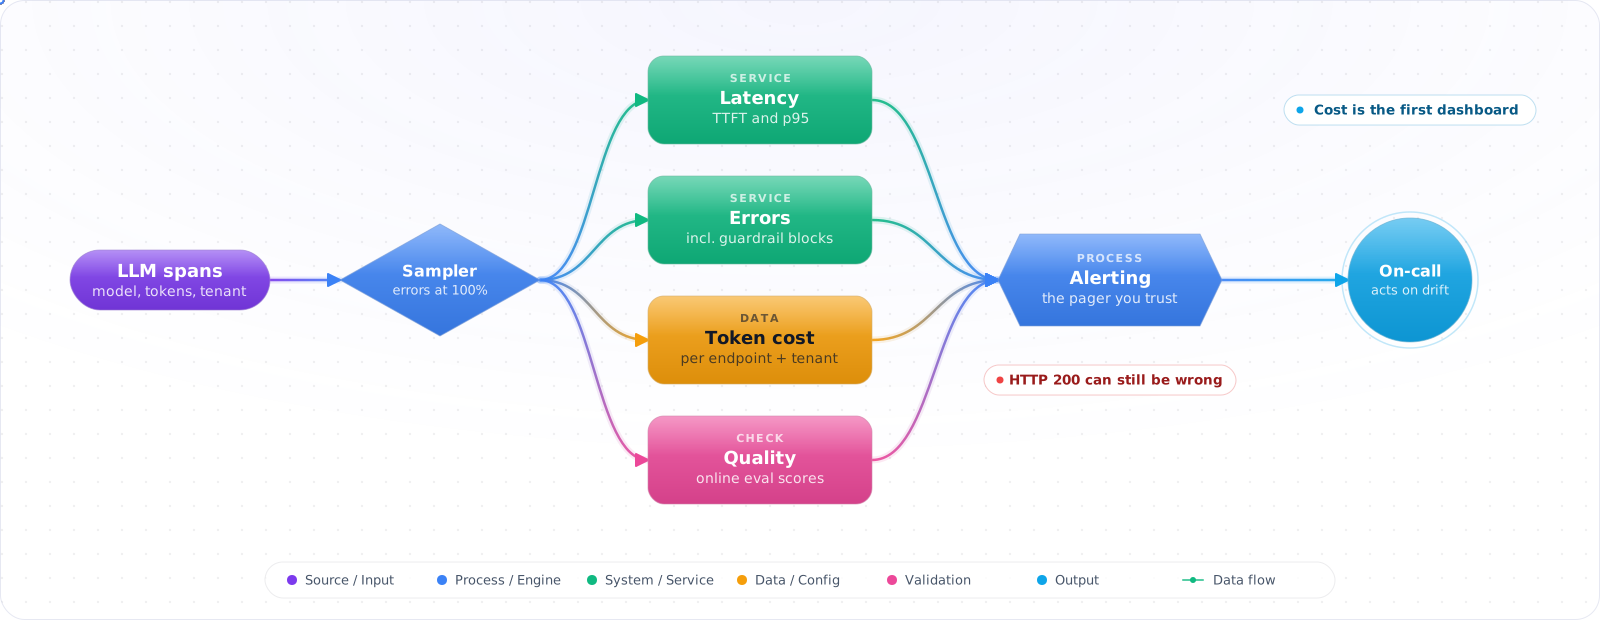
LLM applications fail differently from traditional services. A 200 response can still be wrong, hallucinated, biased, or off-policy. CPU and memory tell you nothing. You need observability designed for non-deterministic, expensive, latency-sensitive calls where the "bug" is often a single tokens-different drift in the output.
- You ship a prompt change and discover the regression in a customer ticket three days later
- Costs jumped 40% and you can't tell which endpoint, model, or tenant
- You have logs but no way to reproduce a single user's session end-to-end
The Four Pillars of LLM Observability
- Traces — one span per LLM call, tool call, retrieval, parsing step. Linked into a session/trace tree.
- Metrics — latency percentiles, token counts, cost, error rate, cache hit rate. Per model, per endpoint, per tenant.
- Quality signals — online evals (faithfulness, relevance), thumbs-up/down, user-reported issues, guardrail block rate.
- Cost telemetry — tokens × price × user/tenant attribution. The metric that makes you fix things first.
flowchart LR
    Q[Request] --> SP[Trace start]
    SP --> RT[Retrieval span]
    SP --> LLM[LLM span<br/>tokens, cost, latency]
    SP --> EV[Eval span<br/>faithfulness, relevance]
    SP --> SE[Trace end]
    SE --> EXP[OTLP exporter]
    EXP --> P[Phoenix / LangSmith /<br/>Datadog / App Insights]
Span Attributes That Earn Their Keep
Every LLM span should carry, at minimum:
gen_ai.provider.name    "openai" | "anthropic" | "azure.ai.openai"
gen_ai.request.model    "gpt-6.1-sol"
gen_ai.request.temperature 0.2
gen_ai.usage.input_tokens 1248
gen_ai.usage.output_tokens 312
gen_ai.response.finish_reasons ["stop"]
gen_ai.usage.cache_read.input_tokens 1024
app.cost.usd            0.0021
app.user.id / app.tenant.id (hashed)
app.prompt.template.id  "support_v3"
app.prompt.template.version "3.2.1"
The OpenTelemetry gen_ai.* semantic conventions are the emerging standard, so adopt them now to keep your vendor choice reversible. The app.* names are custom: keep your own attributes in your own namespace and pin the convention version you emit, because these names still change between releases.
Check it: Open one trace from production and answer four questions from it alone: which model, how many tokens, what it cost, and why it stopped. Any you can't answer is a missing attribute.
Sampling: 100% Traces Are a Trap
Tracing every call at scale is expensive in storage and slow at query time. Sane defaults:
- 100% sampling for errors, guardrail blocks, and negative user feedback.
- 100% for tenants on enterprise tier (you're accountable to them).
- Tail-based sampling for the rest: 10% baseline, boost to 100% if latency > p99 or cost > threshold.
- Always store the full prompt+response for sampled traces — without it the trace is useless.
Check it: Cause an error and a slow request on purpose, then look for both traces. They should always be there, whatever the sampling rate is for ordinary traffic.
Cost Telemetry Is the First Dashboard
Build the cost dashboard before anything else. Group by (model, endpoint, tenant), day-over-day. The moment a tenant 2× their spend overnight or a new endpoint quietly burns $500/day, you need to see it. Cost can also flag quality regressions — retries can spike before users complain.
Check it: Add up one day on the dashboard and compare it with the provider's figure for that day. Then pick the most expensive tenant, and confirm you can see which endpoint the spend came from.
Online Evals: The Quality Pulse
Offline evals (a fixed eval set in CI) catch regressions before shipping. Online evals catch the regressions that only happen on real traffic. Run a lightweight eval (faithfulness, relevance, schema validity) on 1–5% of production traffic and emit it as a metric. When it drops, you have a window of hours rather than days to react.
Check it: Make the prompt worse on purpose in a test environment and watch the online eval metric. It should drop within hours. If it doesn't move, it isn't measuring what you care about.
Vendor Landscape (2026)
- LangSmith — deepest integration with LangChain/LangGraph; strong eval workflows.
- Phoenix (Arize) — open-source, OTLP-native; great for self-hosted, model-agnostic.
- Langfuse — open-source + cloud; pragmatic prompt versioning + evals.
- Datadog LLM Observability / App Insights — if you already pay them for everything else, the cheapest path to one pane of glass.
- Helicone / Traceloop / Honeyhive — viable niche options; pick on integration surface, not feature list.
Failure Modes
- Storing raw prompts with PII — observability becomes a compliance liability. Hash or redact at the SDK level.
- No trace_id propagation — you can't tie a user complaint to a trace. Always thread
trace_idthrough your API responses. - Metrics without dimensions — "average latency" with no model/endpoint split is useless.
- Eval drift — your online eval prompt itself changes and skews the metric. Version the eval prompt.
Try It on Your Own System This Week
Three checks on an LLM feature that is already live, about an hour in total:
- Take one user complaint and find its trace. If you can't get from the complaint to the trace, return the trace ID with every response.
- Name yesterday's most expensive tenant. If that takes longer than opening a dashboard, build the cost view first.
- List your alerts, and the response to each. An alert with no agreed response is noise. Remove it, or give it an owner.
Production Checklist
- OpenTelemetry with
gen_ai.*attributes, one span per LLM call. - Cost-by-tenant dashboard before anything else.
- Tail-based sampling with full prompt/response capture on the sampled set.
- Online evals on 1–5% of traffic, emitted as metrics.
trace_idreturned in every API response header for support workflows.
From Calls to Tasks
Classic LLM monitoring treats each model call as the unit of work. That made sense when an app made one call per request. An agent might make thirty, and the call-level dashboard can be green while the task fails. So add a layer above it, and track tasks: did it finish, what did it cost, how many turns did it take, and did a person have to step in? A user never cares about your p95 per model call. They care whether the job got done.
I would put these on the first screen for any agent: task completion rate, cost per task, turns per task, and the share of runs that hit a limit. Each one catches a failure the call-level view misses. A rising turn count often means the model is confused, or a tool has started returning something unhelpful.
Monitor the vendors as well
Your model provider is a dependency that changes without a deploy on your side. Track error rates and latency per provider and model, and record the exact model version on every span. When behaviour shifts, the first question is whether you changed something or they did, and without version data you can't answer it. Rate-limit errors deserve their own panel too, because 429s often show up as latency, once retries are involved.
Plan for retirements as well. Models now have published end dates, and they arrive quickly. Keep a list of which models you use, where, and when each one retires. A forgotten feature pointing at a retired model fails with no warning at all, usually on a weekend.
Alert on what you can act on
LLM dashboards are full of numbers nobody responds to. A good alert has a clear response. Page someone for an error-rate spike, for a cost burn that will exceed the daily budget by noon, and for a provider outage. Send a daily summary for slow drifts such as quality scores or token growth, since nobody can fix those at 3 a.m. Set budget alerts on projected spend, because by the time the actual bill is high, the money has gone.
Don't log what you can't protect
Prompts and responses are the most useful data you have, and the most sensitive. Decide up front what gets stored, for how long, and who can read it. Hash user IDs, redact obvious personal data, and restrict access to raw prompts. Record-keeping and privacy rules can pull in opposite directions on retention, so settle this with your privacy team before you turn on full capture.
Key Takeaways
- LLM observability is traces + cost + quality, not just APM extended.
- Adopt
gen_ai.*conventions so your tooling choice stays portable. - Online evals close the loop that offline evals can't — ship both.