

Logs You Can Read but Can't Query
An alert fires: order submissions are failing for some customers. You open the log search and find thousands of lines like Failed to submit order 88412 for customer anna@example.com: timeout. You want every failure for one payment provider in the last hour, grouped by error. The provider isn't in the message. The order number is buried in text, so you write a regex. Half the services format the line differently. And the email address in every line has just turned your log store into a personal data store with a 30-day retention nobody chose on purpose.
None of that is a tooling problem. The logs were written for a person reading one line at a time, and at 3 a.m. you need a database. Structured logging means each event is a record with named fields, so the search becomes where provider == "stripe" and outcome == "timeout" instead of a regex. The logging journey follows one failed checkout through four services with a shared trace id. This article is about designing the events themselves, keeping them safe, and paying for them sensibly.
- Incident searches start with a regex over message text
- You can't follow one request across services
- Your log bill grows faster than your traffic
- Someone asked whether your logs contain personal data, and you weren't sure
What a Log Event Should Contain
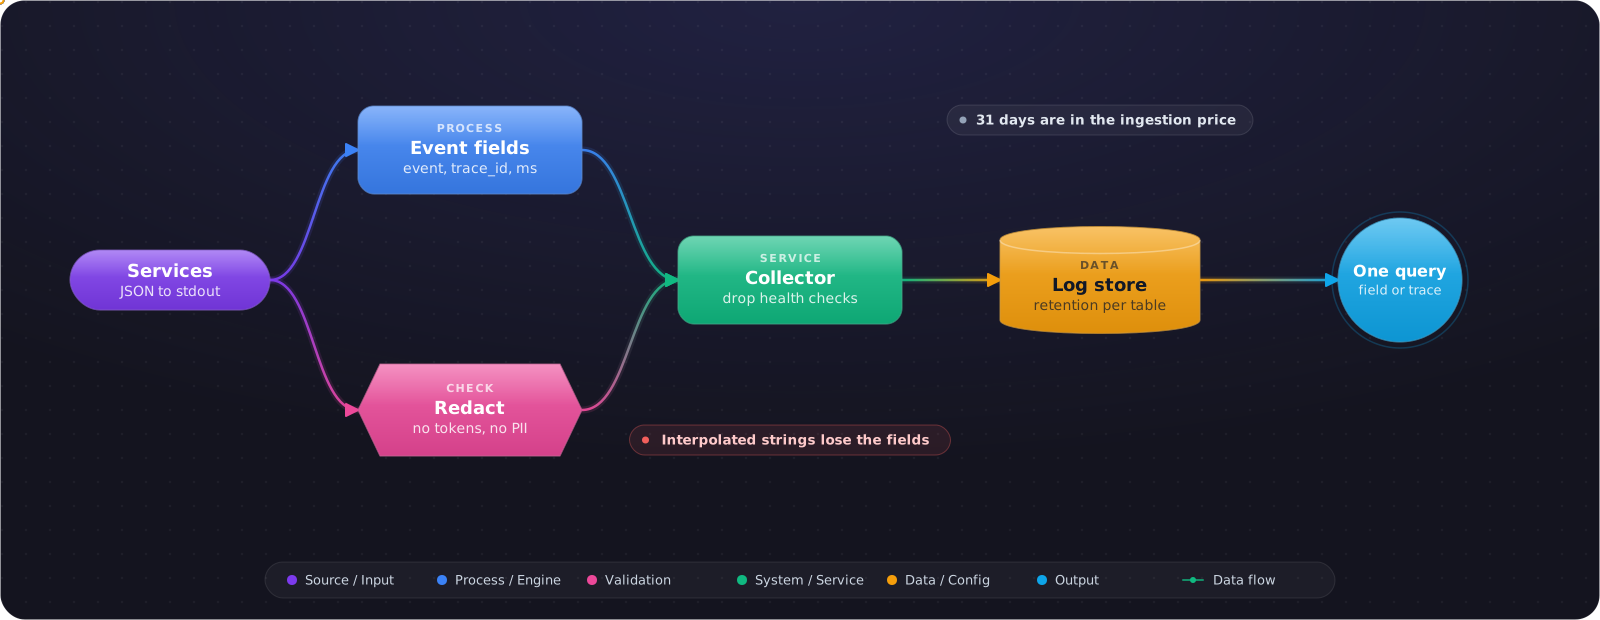
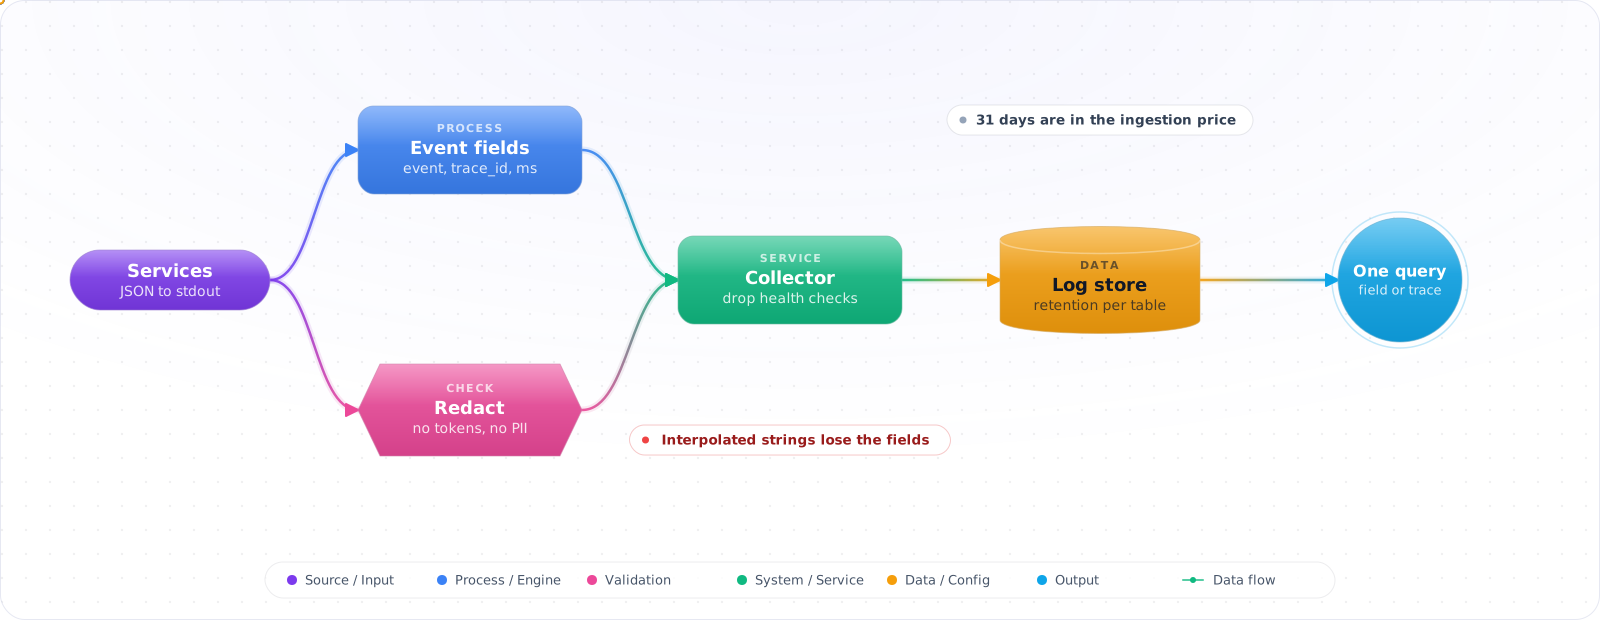
You don't need to invent a schema. The OpenTelemetry log data model defines the fields that matter, and most backends map to it: a Timestamp, the TraceId and SpanId of the request, a SeverityText and normalised SeverityNumber, a Body, Attributes for the event's own fields, and a Resource describing the service that emitted it. On the wire, one event looks like this:
{
  "timestamp": "2026-11-07T14:03:12.481Z",
  "level": "error",
  "event": "order.submit_failed",
  "message": "Order submission failed",
  "trace_id": "0af7651916cd43dd8448eb211c80319c",
  "span_id": "b7ad6b7169203331",
  "service": "order-api",
  "version": "2026.11.3",
  "order_id": "88412",
  "provider": "stripe",
  "outcome": "timeout",
  "duration_ms": 30012,
  "customer_ref": "c_5f2e9"
}
A few choices in that record are deliberate:
eventis a stable name. The message can be reworded;order.submit_failednever changes, so dashboards and alerts key on it.- Values are fields, not text.
duration_msis a number you can aggregate, with the unit in the name. serviceandversionon every line. The first question in an incident is often whether it started with a deploy.customer_ref, not the email. An opaque id still lets support find the customer, without copying personal data into every log line.
Write Templates, Not Interpolated Strings
The habit that breaks structure most often is string interpolation. $"Order {id} failed" produces text, and the id is gone as a field. In .NET, ILogger takes a message template instead: the placeholder name becomes a key and the argument its value.
// Loses the field: the backend only sees text
_logger.LogWarning($"Order {orderId} failed with {provider}");

// Keeps OrderId and Provider as fields
_logger.LogWarning("Order {OrderId} failed with {Provider}", orderId, provider);

// Compile-time generated, no boxing or parsing per call
public static partial class Log
{
    [LoggerMessage(Level = LogLevel.Warning, Message = "Order {OrderId} failed with {Provider}")]
    public static partial void OrderFailed(ILogger logger, string orderId, string provider);
}
The LoggerMessageattribute generates the logging code at compile time, which also gives you one place where each event's shape is defined. Python's standard library follows the same idea: pass a format string and the values as arguments, not a pre-formatted string, and put extra fields in extra for a JSON formatter to pick up.
logger.warning(
    "Order %s failed with %s", order_id, provider,
    extra={"event": "order.submit_failed", "order_id": order_id, "provider": provider},
)
Tie Every Line to a Trace
A field per line is half the value. The other half is the trace id that links one request's lines across services. The W3C Trace Context standard carries it in a traceparent header such as 00-0af7651916cd43dd8448eb211c80319c-b7ad6b7169203331-01: version, 32-hex-digit trace id, 16-hex-digit parent span id, and flags. If your services already use an OpenTelemetry SDK, its logging integration attaches the current trace and span ids to every record for you: OpenTelemetry's documentation says that once an SDK or autoinstrumentation is active, existing logs are correlated with the active trace and span. Check the status for your language first. Logs are a stable signal in the .NET, Java and Rust SDKs, among others, but still in development for Python and JavaScript. Set this up once, in shared code, rather than passing ids through method arguments.
Levels Are an Operational Contract
OpenTelemetry normalises severity into ranges: 1 to 4 TRACE, 5 to 8 DEBUG, 9 to 12 INFO, 13 to 16 WARN, 17 to 20 ERROR, and 21 to 24 FATAL. The numbers matter less than agreeing what each level means for the person on call. This is the contract I use:
| Level | Means | In production |
|---|---|---|
| ERROR | A request or job failed and someone may need to act | Always on; drives alerts through error rates, not single lines |
| WARN | Something unexpected that the code handled, such as a retry that succeeded | Always on; a rising rate is an early signal |
| INFO | A business event worth keeping, such as an order placed or a job finished | On, but one line per meaningful event, not per function call |
| DEBUG / TRACE | Detail for developers | Off by default; turn on for one service or one tenant while investigating |
If an ERROR line doesn't mean someone may need to act, it trains people to ignore errors. A handled validation failure from a user typing a bad email is INFO at most.
What Never Goes in a Log
OWASP's logging cheat sheet lists what should usually not be recorded directly, and should instead be removed, masked, sanitised, hashed or encrypted. The list includes application source code, session identification values (hash them if you need to follow a session), access tokens, authentication passwords, database connection strings, encryption keys and other primary secrets, payment card data, and sensitive personal data. It also flags ordinary personal data such as names and email addresses as needing care, and suggests pseudonymization, which is what the customer_ref above does. Two practices catch most leaks:
- Log fields you chose, not objects you received.
logger.info("request", extra=request.__dict__)logs whatever the caller sent, including theAuthorizationheader. Build the record from named fields. - Redact in the pipeline as a second line of defence. A collector rule that masks anything shaped like a token or a card number catches the line someone added in a hurry.
Structured output also helps with log injection, which OWASP lists among the attacks on logs. When user input is a JSON string value, a newline in it is escaped, so it can't forge a fake line the way it can in a plain-text log.
Getting Logs Off the Machine
In containers, write one JSON object per line to standard output and let the platform collect it. Don't write files inside the container. In Kubernetes the kubelet rotates container logs once a file reaches containerLogMaxSize, 10Mi by default, keeping containerLogMaxFiles, 5 by default. A chatty service that writes faster than your collection agent reads loses lines on rotation, so watch the agent's lag as well as your application.
Querying: Where Structure Pays Off
On Azure, AKS container logs land in the ContainerLogV2 table, where LogMessage is a dynamic column, so JSON log lines can be queried by field without calling parse_json. The question from the opening becomes one KQL query:
ContainerLogV2
| where TimeGenerated > ago(1h)
| where LogMessage.event == "order.submit_failed"
| summarize failures = count() by provider = tostring(LogMessage.provider),
                                  outcome = tostring(LogMessage.outcome)
| order by failures desc
And from an alert straight to one request: ContainerLogV2 | where LogMessage.trace_id == "0af7651916cd43dd8448eb211c80319c" | order by TimeGenerated asc. Elasticsearch or Loki queries look different, but they need the same thing: fields you can filter on.
Retention and Cost
Log volume grows with traffic and with every developer who adds "just one more" line, and most of it is never read. Decide retention per table, not per workspace. In Azure Monitor, tables keep data for 30 days by default (some log tables default to 90), Analytics retention can go up to two years, and total retention, using cheaper long-term storage that you reach through search jobs, up to 12 years. One detail saves arguments: 31 days of Analytics retention are included in the ingestion price, so cutting retention below 31 days doesn't reduce the bill. Reducing what you ingest does.
The changes that cut volume without losing what you need:
- Drop health check and readiness probe logs at the collector; they say the same thing thousands of times a day.
- Keep DEBUG off in production, and turn it on by service or tenant when you need it.
- Log one summary line per request with its duration and outcome, instead of a line at every step.
- Move high-volume, rarely-queried logs to a cheaper table plan, and keep audit and security logs on the retention your compliance rules require.
What Goes Wrong
1. JSON with the useful part still in the message
{"msg": "order 88412 failed: timeout"}is structured in name only. OpenTelemetry's documentation makes the same point: JSON without a stable schema is semistructured. If you would filter or group by it, it needs its own field.
2. The same field under three names
orderId in one service, order_id in another, OrderIDin a third, and every query needs all three. Agree a naming convention, or adopt OpenTelemetry's semantic conventions, and check it in review.
3. Logging instead of metrics
Counting lines to build a request-rate chart is slow and expensive. Rates, latencies and error ratios belong in metrics; logs explain an individual case.
4. Alerting on single log lines
One ERROR line paging someone at night leads to muted alerts. Alert on rates and on SLOs; the alerting topic covers how.
5. Retention set by default
Nobody chose 30 days, and nobody checked whether security logs need longer. Write retention down per table, with the reason.