
Start With a Dashboard You Check
If nobody is on call for a service, you don't need alerts, only a dashboard that someone looks at during the day. Alerting begins when a person can be woken up, and from then on every rule has to justify the interruption.
Bad alerting is worse than no alerting. Pages at 3 a.m. for transient blips train the on-call to mute everything; missed alerts on real incidents bleed users. Good alerting is a small number of rules, each tied to user-visible symptoms, with a runbook and an owner. Everything else is a dashboard.
- On-call gets 40 pages a night; nobody can find the real incident among them
- Your last outage hit users for 20 minutes before any alert fired
- Alerts are tied to CPU/memory, not to user impact
Alert on Symptoms, Not Causes
Alert when the user is unhappy: error-rate spike, latency SLO burn, broken checkout. Cause-based alerts (high CPU, queue depth) belong on dashboards and as auto-remediation triggers, not as pages. A high CPU that doesn't affect users is not an incident.
flowchart LR
    M[Metrics + logs + traces] --> S[Symptom rules<br/>SLO burn, error rate, saturation]
    M --> C[Cause rules<br/>CPU, queue, retries]
    S --> P[Page]
    C --> AR[Auto-remediate / dashboard]
    P --> RB[Runbook]
    RB --> OC[On-call]
Check it: Go through last week's pages and mark each as a symptom users felt, or a cause. Every cause on the list is a candidate to become a dashboard panel.
SLOs and Burn-Rate Alerts
The Google SRE multi-window burn-rate pattern is the modern default. The SRE Workbook suggests these starting points for a 30-day SLO:
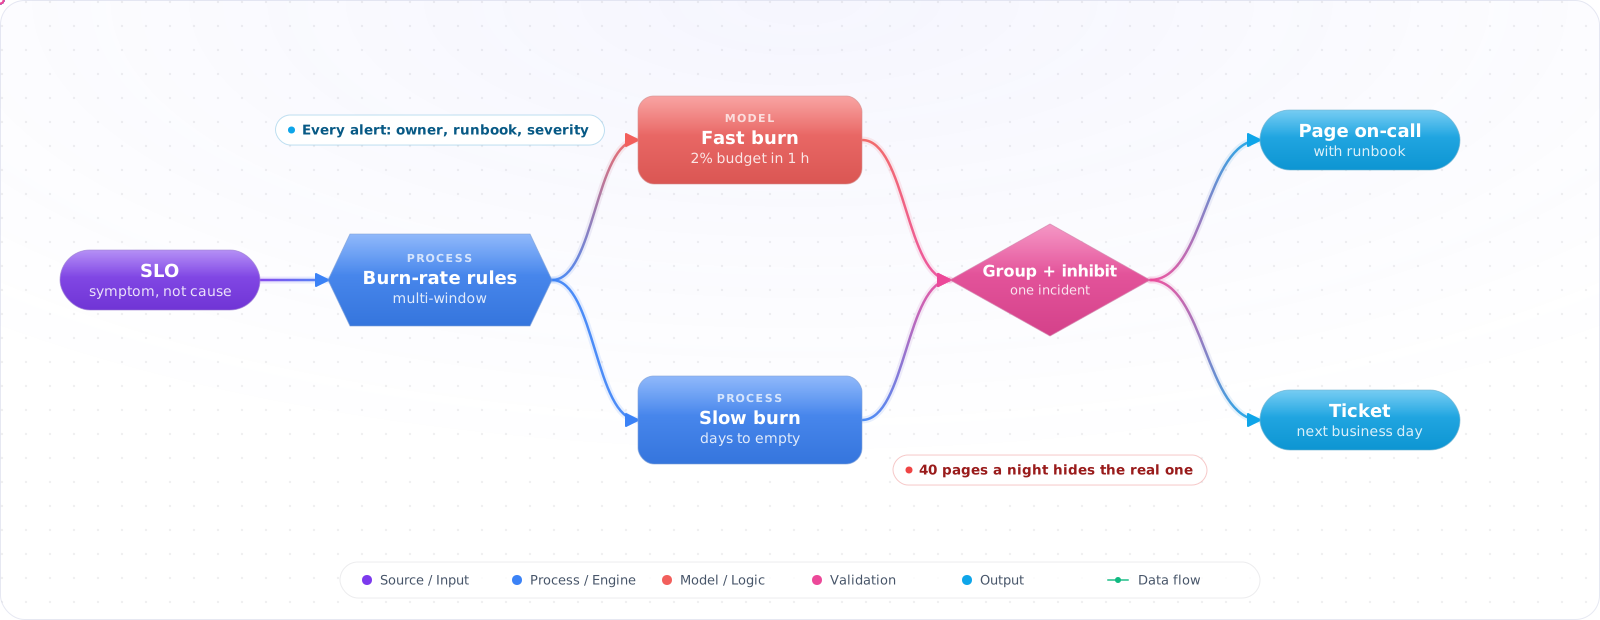
- Fast burn — 2% of monthly error budget in 1 hour (14.4× rate). Page immediately.
- Slower burn — 5% in 6 hours (6× rate). Also a page in the SRE Workbook's starting numbers.
- Slow burn — 10% in 3 days (1× rate). A ticket for the next working day.
Burn-rate alerts catch real degradations without flapping on single-minute blips. Required: a defined SLI (e.g. successful HTTP 200/non-429 requests < 500 ms) and an SLO (99.9% per 30 days).
Check it: Work out how much of this month's error budget is left. If nobody can produce the number, the SLO isn't wired to anything.
The Five Things Every Alert Must Have
- Owner — a team alias, not a person.
- Runbook link — "what to check, in what order". No runbook = delete the alert.
- Severity — page (wake up) vs ticket (next business day). One scale, ruthlessly applied.
- Dashboard link — direct to the chart that proves/disproves the symptom.
- Recent deploys — auto-attached. Google's SRE book puts roughly 70% of outages down to changes in a live system, so the last deploy is the first suspect.
Check it: Open your noisiest alert and look for its owner, runbook, severity and dashboard link. Whatever is missing is why it gets ignored.
Alert Hygiene Metrics
Track and review monthly:
- Pages per shift — > 2 means you have noise to cull.
- False-positive rate — > 30% means thresholds need tuning.
- Time-to-acknowledge — rising trend means alert fatigue.
- Mean time to detect (MTTD) — the value alerting actually delivers.
Multi-Window, Multi-Burn-Rate in PromQL
# Prometheus rule file. Fast burn: > 14.4× over 1h AND > 14.4× over 5m (99.9% SLO)
groups:
  - name: api-slo
    rules:
      - alert: ApiErrorBudgetFastBurn
        expr: |
          (
            sum(rate(http_requests_total{code=~"5.."}[1h]))
              / sum(rate(http_requests_total[1h])) > (14.4 * 0.001)
          )
          and
          (
            sum(rate(http_requests_total{code=~"5.."}[5m]))
              / sum(rate(http_requests_total[5m])) > (14.4 * 0.001)
          )
        labels:
          severity: page
        annotations:
          runbook_url: https://wiki/runbooks/api-error-rate
          dashboard: https://grafana/d/api-errors
Inhibition and Grouping
- Inhibition — if "cluster down" fires, don't also page for every individual service in that cluster.
- Grouping — bundle alerts by service/cluster into one page with N items, not N pages.
- Routing — service A pages team A, service B pages team B; shared infra pages SRE. Define in code, review quarterly.
Check it: Take down a shared dependency in a test environment and count the pages. One grouped page is right. A page for every service means inhibition isn't working.
Notification Channels
- Page — phone call/push (PagerDuty, Opsgenie, Squadcast). Reserve for "wake up now".
- Ticket — Slack/Teams + Jira/Linear issue. For things that can wait until morning.
- Status page — auto-updated from a small set of customer-impact alerts. Subscribers love this.
Failure Modes
- CPU/memory pages — alert on saturation symptoms (queue grows, latency rises), not the raw resource.
- Threshold drift — "always 500 errors/min" becomes the new normal; tighten thresholds quarterly.
- One giant rule file — no ownership, no review. Split by service, store in the service's repo.
- Alerts without runbooks — on-call starts every page by guessing which dashboard to open.
Try It on Your Own System This Week
Three checks on an on-call rotation, about an hour in total:
- Count the pages per shift for the last month. More than two means there is noise to remove.
- Find the alerts with no runbook. Write three bullet points for each, or delete the alert.
- Check how your last outage was detected. If a customer told you, an alert on that symptom is missing.
Production Checklist
- Burn-rate alerts on every user-facing SLO; fast + slow window pair.
- Owner, runbook, severity, dashboard, recent-deploys on every alert.
- Inhibition rules so one cluster-down doesn't produce 200 pages.
- Monthly alert-hygiene review: cull silent, flapping, ownerless rules.
Alerting on AI Systems and Fixing Alert Fatigue
Alert fatigue is a people problem with a technical cause. If an on-call engineer gets paged twice a night for things that fix themselves, they will start ignoring pages, and the real one gets missed. Review every page in a weekly meeting and ask: did this need a human, right now, and could a human do something about it? If the answer is no, delete it or turn it into a ticket. Track the number of pages per on-call shift, and aim for no more than a couple. Tracking the share of alerts that led to action is even better. If it's below about half, you have a tuning job to do.
Every alert also needs a runbook link. At 3 a.m., nobody should be working out from scratch what an alert means. Even a short note saying what to check first shortens incidents a lot.
What's different for AI features
Traditional alerts fire on errors and latency. An LLM feature can return 200s all day while giving wrong answers, so you need other signals:
- Cost burn: alert when today's projected spend exceeds your budget, since a runaway agent can burn a month's money in an hour.
- Refusal or fallback rate: a spike often means a model or prompt changed.
- Provider health: 429s and 5xx per model, because your dependency can degrade without warning.
- Quality scores: use a daily digest rather than a page, since nobody can fix a drift score at 3 a.m.
Use the same burn-rate approach as for SLOs. A cost alert based on the rate of spend, with a short and a long window, catches a loop in minutes without firing on a single expensive request.
Keep alerts close to the service
Teams that own a service should own its alerts, in the same repository, reviewed in the same pull requests. Alert rules in a shared UI that nobody reviews tend to rot. Test them as well. Tools such as promtool test rules let you check PromQL alert logic against sample data, and a routine game day where you break something on purpose shows whether the alert fires, and whether the runbook still makes sense. An alert that has never fired isn't proven to work.
Finally, separate symptoms from causes when you route. Page on what users feel, and link the cause-based dashboards from the alert, so that one incident gives you one page and not forty.
Review After Every Incident
Each incident is a free test of your alerts. Ask whether the first alert came from your monitoring or a customer, and how long it took. If a customer told you first, that's the alert to write next. Remove one that didn't help, too, so the total doesn't only ever grow.
Key Takeaways
- Alert on user-visible symptoms; everything else is a dashboard or an auto-remediation hook.
- Burn-rate alerts are the modern default — they catch real degradations without flapping.
- An alert without an owner and a runbook is noise; delete or fix it.