

You Are Not Buying a Model, You Are Running a Service
The conversation usually starts with an invoice or a compliance review. The API bill crossed some line, or legal said customer documents cannot leave the region, and someone suggests running an open-weight model on our own GPUs. Two weeks later the model answers prompts on a test box, and everyone agrees the hard part is done.
It is not. Getting a model to respond is an afternoon. Running it as a service that stays up under load, scales, gets patched and costs less than the API it replaced is the actual project. This article covers the decisions that determine whether that project succeeds: whether to self-host at all, how to size the hardware, which inference server to run, and what to watch once it is live.
- Data cannot leave your network or region, and no provider deployment satisfies that
- Traffic is high and steady enough to keep GPUs busy most of the day
- You need a fine-tuned or specialised open model the APIs do not offer
- You need latency or locality guarantees a shared endpoint cannot give
“It will be cheaper” on its own is not on this list. It is cheaper only at sustained utilisation, and spiky traffic rarely gets there.
Do the Break-Even Maths First
An API charges per token. A GPU charges per hour whether it is busy or not. The question is how many tokens an hour you can push through the GPU at the quality and latency you need, and how many of those hours are actually busy.
effective cost per 1M tokens =
    (GPU cost per hour x hours provisioned)
  / (tokens served per hour at target latency x hours provisioned x utilisation)
  x 1,000,000

Inputs you measure, not guess:
  GPU cost per hour      your cloud or hardware quote
  tokens served per hour from a benchmark with YOUR prompt and output lengths
  utilisation            share of provisioned hours spent serving real traffic
Utilisation is the term that sinks most business cases. A service that runs at full throughput during office hours and idles at night is roughly 30 to 40% utilised across a week, which can more than double the effective cost per token. Before buying anything, export a week of request timestamps and token counts from your current API usage and plot it per hour. If the shape is a sharp daytime peak, price in either autoscaling to zero (with slow cold starts, covered below) or paying for idle GPUs.
Also count the people. Someone owns driver updates, model upgrades, incident response and capacity planning. If that is a fraction of an engineer you did not budget, the comparison is not apples to apples.
Sizing: Weights Plus KV Cache
GPU memory goes on two things. The weights are fixed: parameters multiplied by bytes per parameter. The KV cache grows with every token of every request in flight, and it is what limits how many users you can serve at once.
weights   = parameters x bytes per parameter
            FP16/BF16 = 2 bytes, FP8 = 1 byte, INT4 = about 0.5 bytes

KV cache per token = 2 (K and V) x layers x KV heads x head dim x bytes

Example: an 8B model with grouped-query attention
  (32 layers, 8 KV heads, head dim 128, FP16 cache)
  weights  = 8B x 2 bytes          = 16 GB
  KV/token = 2 x 32 x 8 x 128 x 2  = 131,072 bytes = 128 KiB
  one 32k-token conversation       = 4 GiB of KV cache
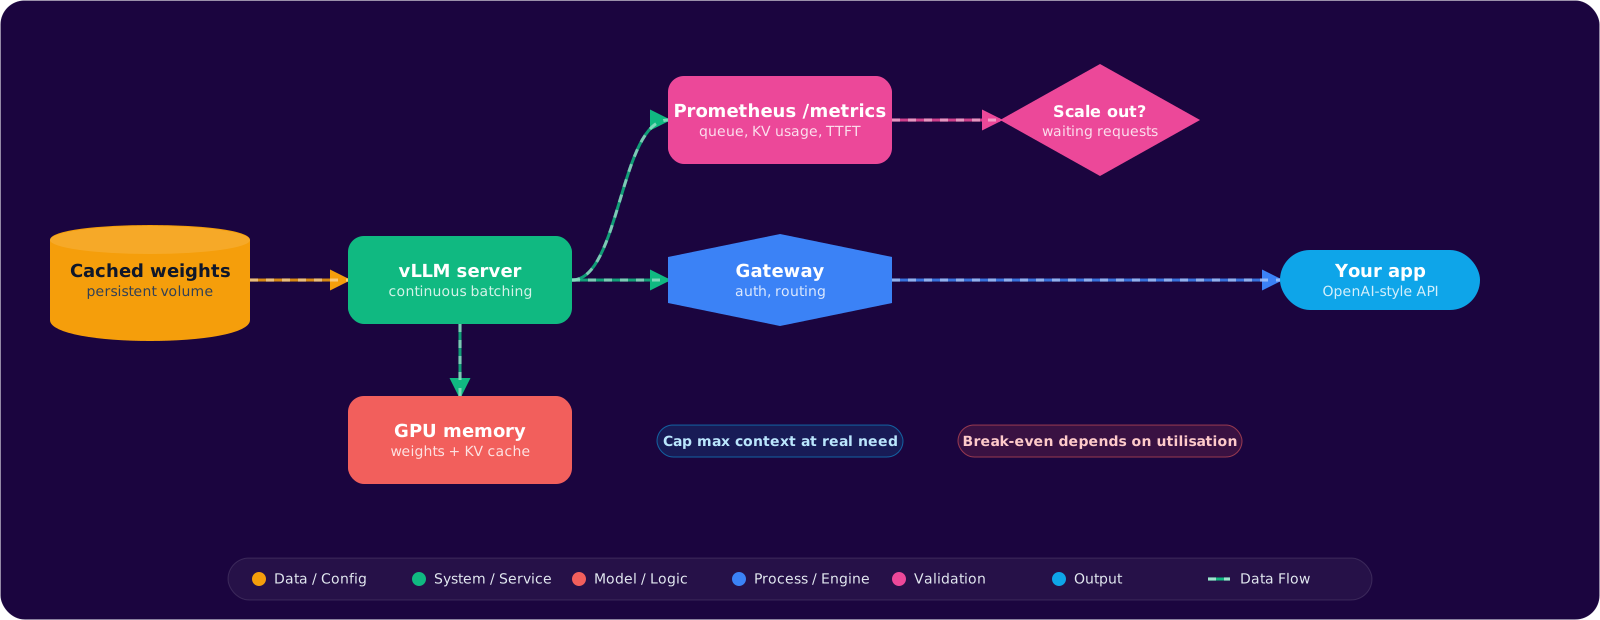
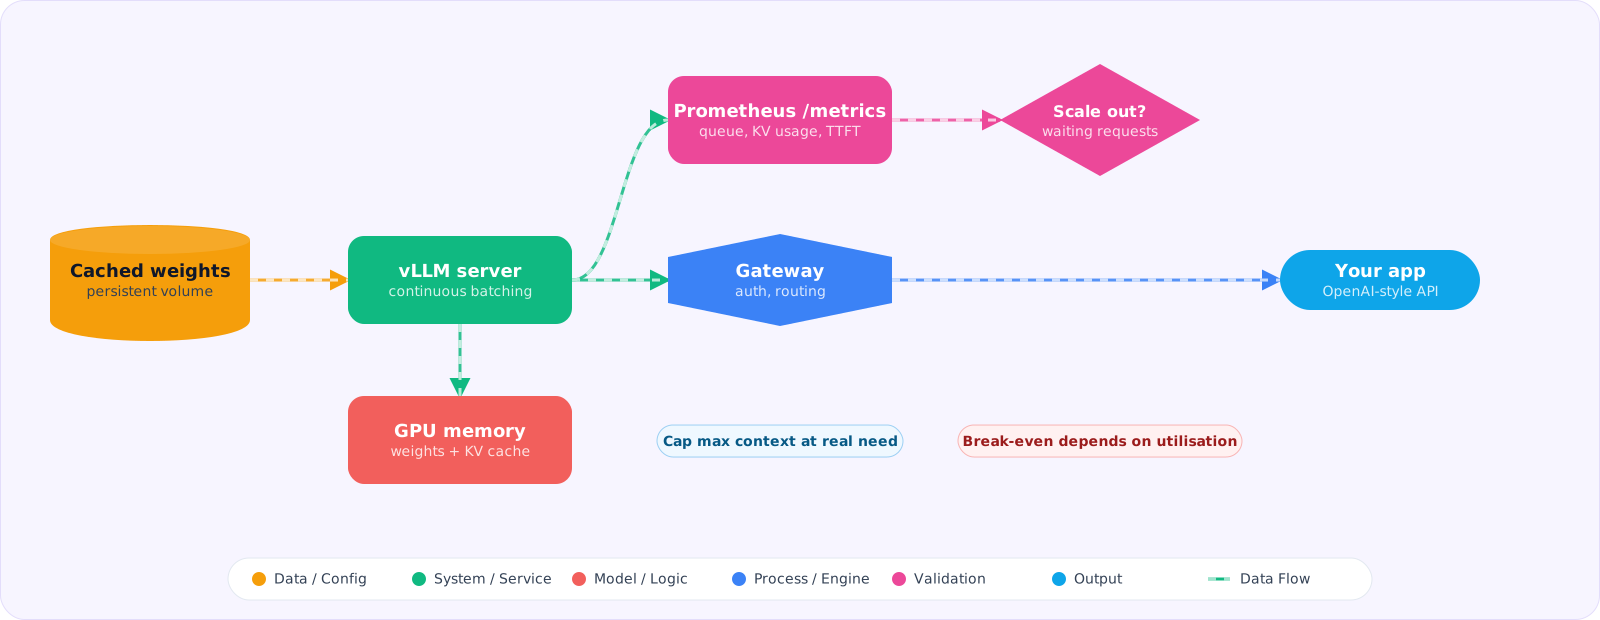
On an 80 GB card with 90% of memory given to the server, the 16 GB of weights leave about 56 GB of cache: roughly a dozen full 32k-token conversations at once, or many more short ones. That is why the maximum context length you configure matters so much: allowing 128k tokens per request when your real prompts are 4k reserves capacity you will never use. Set the limit from your actual prompt distribution, with headroom, not from the model card.
For models that do not fit on one GPU, tensor parallelism splits each layer across GPUs in the same machine. It needs fast interconnect between the cards, so keep a tensor-parallel group inside one node. Quantisation is the other lever: FP8 roughly halves weight memory with a small quality cost on most tasks, and INT4 halves it again with a larger and more task-dependent cost. Measure on your own evaluation set before and after; averages from someone else’s benchmark do not tell you what happens to your extraction prompts.
Choosing an Inference Server
| Server | Strength | Where I use it |
|---|---|---|
| vLLM | PagedAttention for KV memory, continuous batching, prefix caching, OpenAI-compatible API, wide model support | The default for production GPU serving |
| SGLang | RadixAttention prefix sharing and fast structured output; strong on agent-style workloads with shared prefixes | When many requests share long prefixes or need constrained decoding at volume |
| llama.cpp / Ollama | Runs GGUF quantised models on CPUs, laptops and small GPUs with almost no setup | Development, demos and low-traffic internal tools |
Continuous batching is the feature that makes the economics work. Instead of waiting for a batch to finish, the server adds new requests to the running batch as slots free up, so a GPU serving many users produces far more tokens per second than one serving requests one at a time. Any server without it is a development tool.
A Production-Shaped vLLM Launch
vllm serve meta-llama/Llama-3.3-70B-Instruct \
  --tensor-parallel-size 4 \
  --max-model-len 16384 \
  --gpu-memory-utilization 0.90 \
  --api-key "$VLLM_API_KEY" \
  --port 8000
--tensor-parallel-size 4splits the 70B model across four GPUs in one node.--max-model-len 16384caps context at what the application really sends, which frees KV cache for more concurrent requests.--gpu-memory-utilization 0.90lets vLLM claim 90% of each card for weights and cache, leaving headroom for the CUDA context.--api-keybecause an inference server with no authentication on an internal network is a data-exfiltration endpoint waiting to be found. Put it behind your gateway as well.
Then benchmark with your traffic shape before you promise anyone a latency: vllm bench serve with input and output lengths taken from your real prompts, at the concurrency you expect at peak. Short synthetic prompts flatter every server.
Running It on Kubernetes
Most teams end up on a Kubernetes cluster with a GPU node pool. The parts that differ from a normal web service:
- Cold starts are minutes, not seconds.Pulling a large image and loading tens of gigabytes of weights takes time. Cache weights on a persistent volume or node-local disk instead of downloading them on every start, and set the readiness probe on the server’s health endpoint so traffic arrives only after loading finishes.
- Scale on queue depth, not CPU. CPU tells you nothing about a GPU server. Scale on waiting requests or KV cache usage exported to Prometheus, through KEDA or a custom metrics adapter.
- One model per deployment. Different models have different memory profiles and upgrade cycles. Route between them in a gateway rather than packing them into one pod.
What to Watch
vLLM exposes Prometheus metrics on /metrics. The handful that tell you the most:
| Metric | What it tells you |
|---|---|
vllm:num_requests_waiting | Requests queued for a slot. Sustained growth means you need more capacity. |
vllm:kv_cache_usage_perc | Share of KV cache in use. Near 1.0, the server starts preempting requests and latency jumps. |
vllm:time_to_first_token_seconds | How long users wait before anything streams. Alert on p95, not the mean. |
vllm:inter_token_latency_seconds | Streaming speed once output starts. Degrades as batches grow. |
vllm:prefix_cache_hits / queries | How often shared prompt prefixes are reused. A low ratio on a chat workload usually means the system prompt changes per request. |
- Self-host for data control, steady volume or a model you cannot get otherwise; cost alone rarely justifies it.
- Effective cost depends on utilisation. Plot your real traffic before you buy GPUs.
- Memory is weights plus KV cache; cap context length at what you actually send.
- vLLM is the default server. Benchmark with your own prompt and output lengths.
- Scale on queue depth and KV usage, cache weights locally, and put authentication in front.
Pitfalls
Benchmarking with toy prompts
Fifty-token prompts and fifty-token answers produce throughput numbers you will never see in production, where a RAG prompt is several thousand tokens. Prefill on long prompts is where latency goes. Benchmark with real lengths.
Wrong chat template
Open models expect a specific chat format. Send raw text or the wrong template and quality drops in ways that look like a bad model. Use the server’s chat completions endpoint so the model’s own template is applied, and check it whenever you change model versions.
Licence terms nobody read
“Open weights” does not mean no conditions. Some licences restrict use above a user count, require attribution or prohibit certain uses. Have someone read the licence of the exact model version before it carries production traffic.
Swapping models without an eval
A newer model with better benchmark scores can still be worse on your task. Run your evaluation set against the candidate behind the same server settings, and roll it out gradually behind the gateway, as you would any other dependency upgrade.