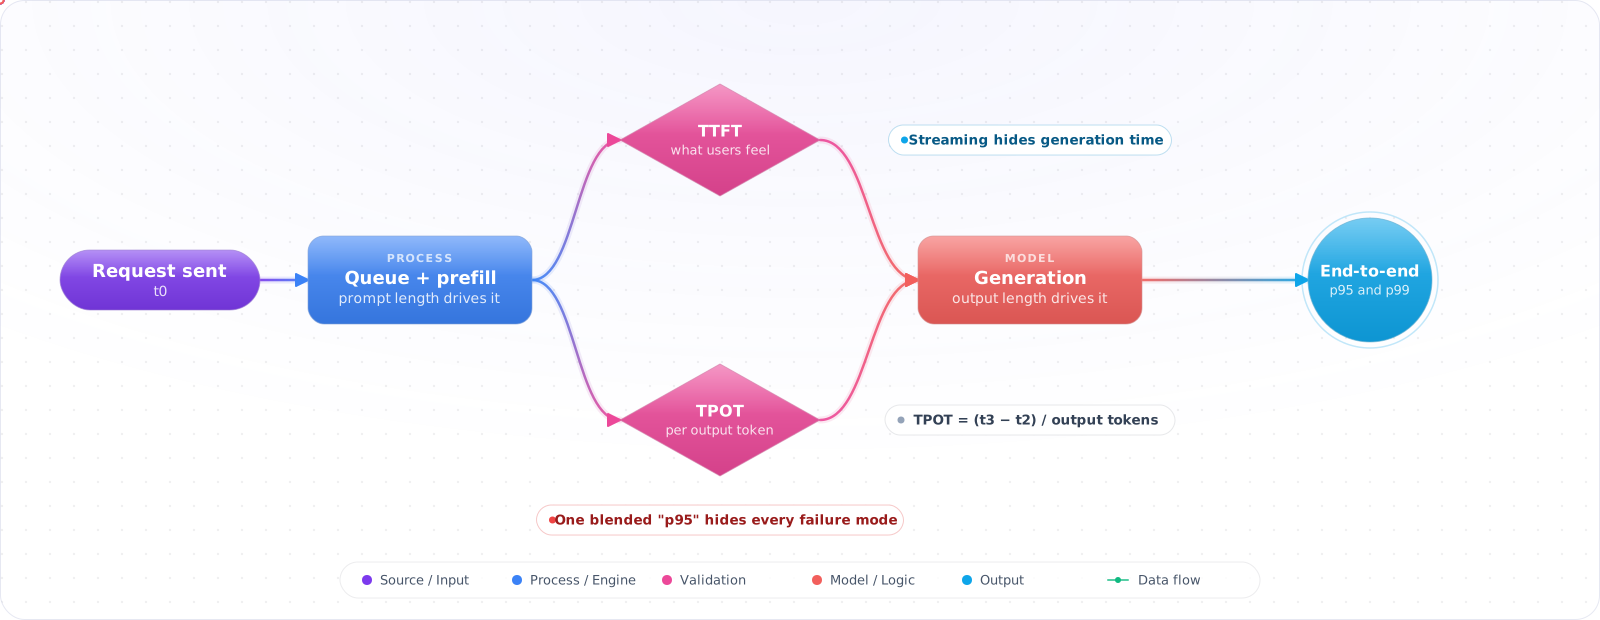

Start With One Number
While nobody complains, one end-to-end latency number is enough, and splitting it further is work with no payoff. Split it on the day someone says the feature is slow, because that single number can't tell you which part to fix.
"The LLM is slow" isn't a metric. There are at least four latencies that matter for an LLM-backed feature, and they degrade for different reasons. Confusing them — or aggregating them into a single "p95 latency" — hides every interesting failure mode.
- Your "LLM latency" chart is a single line and you can't explain spikes
- Users complain it "feels slow" but your p95 is fine
- You can't tell whether to optimise the model, the prompt, the network, or the streaming pipeline
The Four Latencies
- TTFT (time-to-first-token) — from request sent to first token received. Dominates perceived responsiveness.
- TPS / TPOT (tokens-per-second / time-per-output-token) — generation throughput once streaming starts.
- Total generation time — TTFT + (output_tokens × TPOT). The number to use for timeouts and capacity planning.
- End-to-end (E2E) — what the user sees: includes auth, retrieval, guardrails, post-processing, network back to client.
flowchart LR
    U[User clicks] -->|t0| API[API gateway]
    API -->|auth| RAG[Retrieval]
    RAG -->|t1| LLM[LLM provider]
    LLM -->|t2: first token| STR[Stream to client]
    STR -->|t3: last token| POST[Guardrails + format]
    POST -->|t4| U
TTFT = t2 - t1. TPOT = (t3 - t2) / output_tokens. E2E = t4 - t0.
Check it: Take one slow request and write down all four numbers for it. If you can only produce the end-to-end figure, you can't yet say whether the model is the slow part.
What Drives Each
- TTFT — input length (KV cache prefill), provider load, region, model size, queueing.
- TPOT — model size, provider capacity.
- Total generation — output length × TPOT; cut output length, cut total.
- E2E — everything above + your own retrieval/guardrails/post-processing overhead.
The Right Percentiles
Always look at p50, p95, p99 per metric. P50 tells you the "feels like", p95 catches creeping regressions, p99 catches the long-tail nightmares (cold model loads, regional failover). Mean is a lie for LLM latency distributions — they are heavy-tailed.
Check it: Put the mean and the p99 of the same metric next to each other. If they're far apart, the mean has been hiding your worst experiences.
Streaming Changes Everything
With streaming, the user starts reading as the tokens arrive. The metric you optimise is no longer total generation; it is TTFT plus a streaming rate faster than people read. A model that finishes in 4 s total but starts in 1.8 s can feel worse than one that finishes in 6 s but starts in 0.4 s.
Check it: Time the gap from pressing enter to the first visible word, on a real device over a real network. That's the number users judge you on.
The Levers
- Cut input tokens — shorter context = faster prefill = lower TTFT. Often the cheapest win.
- Prompt caching — cached prefixes skip recomputation, which lowers TTFT on long prompts.
- Smaller / distilled model — usually a lower TPOT than a larger model. Use task-specific routing.
- Speculative decoding / draft models — provider-side; available on some hosted models. A TPOT win when enabled.
- Provisioned throughput (such as Azure PTU) — reduces queueing variance for steady workloads.
- Region pinning — the same continent as your app server cuts network round-trip time.
Check it: Change one lever at a time and measure the latency it's meant to move. Cutting input should lower the time to first token. If the total drops and that doesn't, something else changed.
Measuring TTFT in Streaming Code
const t1 = performance.now();
const stream = await client.chat.completions.create({
  model, messages, stream: true,
  stream_options: { include_usage: true },   // adds a final chunk with usage
});

let ttft = 0, outputTokens = 0, t2 = 0;
for await (const chunk of stream) {
  if (!t2 && chunk.choices[0]?.delta?.content) {
    t2 = performance.now();
    ttft = t2 - t1;
  }
  // Chunks aren't tokens, so take the count from the provider
  if (chunk.usage) outputTokens = chunk.usage.completion_tokens;
}
const t3 = performance.now();
metrics.histogram('llm.ttft.ms', ttft, { model });
metrics.histogram('llm.tpot.ms', (t3 - t2) / outputTokens, { model });
Failure Modes
- Conflating E2E with model latency — your "LLM is slow" alert fires because retrieval got slow.
- Aggregating across models — gpt-6.1-sol and gpt-6-luna in one chart hides everything useful.
- No TTFT metric at all — streaming UX optimisations are invisible.
- Sampling out the tail — if you only capture 1% you miss p99. Use tail-based sampling that prioritises slow requests.
Try It on Your Own System This Week
Three checks on a feature that feels slow, about an hour in total:
- Split your latency chart by model. Two models on one line hide everything useful.
- Measure from the client. Provider dashboards leave out your network, gateway, retrieval and guardrails.
- Look at your longest outputs. Total time grows with output length. If the long answers aren't needed, ask for less.
Production Checklist
- Four metrics, not one: TTFT, TPOT, total generation, E2E.
- p50/p95/p99 per metric per model per endpoint.
- SLOs phrased in TTFT and TPOT, not just total — they map to UX.
- Tail-biased sampling so the slow requests are over-represented in your traces.
Latency for Reasoning Models and Agents
Reasoning models broke some of the old rules of thumb. Time to first token used to mean "how fast did it start answering". Now the model may think for many seconds before the first visible token, and a higher effort setting can stretch that further. If you measure TTFT on a reasoning model, you are mostly measuring thinking time. Separate it where the API lets you, and track time to first visible output as its own number. For a chat UI, stream a status such as "Searching the docs..." so the wait doesn't feel like a hang.
Effort is now a latency control as well as a quality one. Running at low effort on routine requests can cut seconds off each call, and a lot of production traffic doesn't benefit from more. Test this on your eval set, because the saving is often free.
Agents have a different latency shape
A user waiting on an agent is waiting for a sequence. Each turn adds model time and tool time, and the total grows with the number of steps. Break a slow run down in the trace by span, because the cause is rarely what you'd guess. Usually one slow tool or one extra loop accounts for most of the time, and the model is fine.
Some quick wins follow from that. Run independent tool calls in parallel, since sequential calls add up and parallel ones only cost the slowest. Cap the size of tool results, because a 40,000-token result slows the next model call as well as costing money. Cache slow lookups that repeat across a session.
Long waits need a different design
If a task takes minutes, stop trying to make it feel instant. Give the user a task they can leave and come back to, with progress updates and a notification when it finishes. A background job with a status page is a better experience than a spinner, and it also survives a closed tab. This is the shift behind durable agents, and behind MCP's tasks extension.
Measure what users feel
Provider dashboards report their own latency, which excludes your network, gateway, retrieval and guardrails. Measure from the client, and track the full path. Watch for queueing, too: a p50 that holds steady while the p99 climbs usually means you are hitting rate limits and retrying, and you will find that in your gateway logs rather than in the model's numbers. Retry storms are a common cause of bad tail latency, so use exponential backoff with jitter, and put a limit on total time spent retrying.
Key Takeaways
- TTFT is the perceived-latency king for streaming apps; TPOT keeps the perception going.
- The right intervention depends on which of the four latencies is the bottleneck — diagnose before you optimise.
- Prompt caching, smaller-model routing and region pinning are good levers to try first.