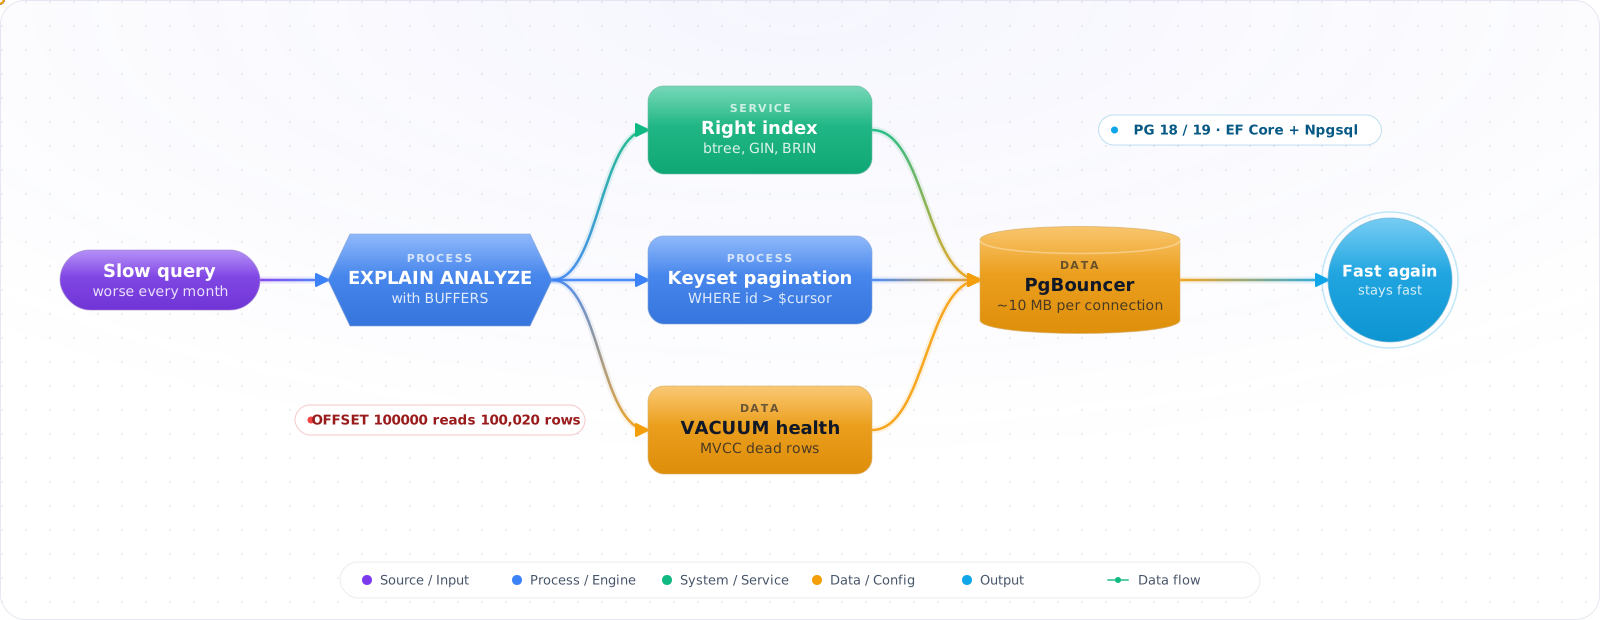

Start With the Defaults
On a small table, Postgres is fast with no tuning at all, because there's little to scan. Leave it alone. The work below starts when a table has grown enough that one query is noticeably slower than it used to be.
At launch the order-history page was instant. Now it takes four seconds for your best customers, the ones with the most orders, and the first suggestion in the meeting is a bigger database server.
Usually the plan, not the hardware, is the problem. Postgres has kept getting better (versions 17 and 18 improved replication, vacuum and performance) and it will tell you exactly where a query spends its time if you ask with EXPLAIN ANALYZE. Below are the features worth knowing, CTEs, window functions and JSONB among them, and the habits that keep queries fast as tables grow.
- You added Redis just to do a fast counter that
UPDATE ... RETURNINGwould handle - You stored JSON as
TEXTand parse it in app code instead of usingJSONB - You don't know the difference between
btree,GIN, andBRINindexes - You polled a queue table instead of using
FOR UPDATE SKIP LOCKED
What Makes Postgres Fast, or Slow
Postgres is built around three orthogonal axes that combine into nearly every advanced feature:
- MVCC — every row has
xmin/xmax; readers never block writers and vice versa. - Index types —
btree(default),hash,GIN(inverted, for arrays/JSONB/full-text),GiST(geometric/range),SP-GiST,BRIN(block-range, for huge append-only tables). - Extensions —
pgvector,PostGIS,TimescaleDB,pg_trgm,pg_partman,pg_cronall hook into the same query planner.
flowchart LR
    Q["SQL Query"] --> P["Parser"]
    P --> R["Rewriter<br/>(views, RLS)"]
    R --> O["Planner / Optimizer<br/>(cost-based, uses pg_statistic)"]
    O --> E["Executor"]
    E --> A["Access Methods<br/>btree | GIN | GiST | BRIN"]
    A --> S["Storage<br/>(heap + WAL + MVCC)"]

    style O fill:#0078D4,color:#fff,stroke:#005a9e
    style S fill:#16a34a,color:#fff,stroke:#15803d
Working With Plans, Indexes and Advanced SQL
Step 1: Pick the right column type
-- Use generated columns instead of triggers for derived data
CREATE TABLE orders (
    id          bigint GENERATED ALWAYS AS IDENTITY PRIMARY KEY,
    customer_id bigint NOT NULL,
    status      text   NOT NULL DEFAULT 'open',
  items       jsonb  NOT NULL,
    total_cents int    GENERATED ALWAYS AS
                  ((items->>'total_cents')::int) STORED,
    created_at  timestamptz NOT NULL DEFAULT now()
);

-- JSONB beats TEXT here: JSON operators, indexing, and rejection of invalid JSON
SELECT items->'lineItems'->0->>'sku' FROM orders WHERE id = 1;Check it: Look through one table's column types for a value stored as text that is really a number, a date or JSON. Each one is a check the database could be doing for you.
Step 2: When the plan shows a full scan, index for the query
-- Partial index: only rows we actually query
CREATE INDEX idx_orders_open ON orders (created_at)
WHERE status = 'open';

-- GIN on JSONB for containment queries
CREATE INDEX idx_orders_items ON orders USING GIN (items jsonb_path_ops);
SELECT * FROM orders WHERE items @> '{"lineItems":[{"sku":"ABC-123"}]}';

-- BRIN for huge tables whose rows are stored in time order: far smaller than a btree
CREATE INDEX idx_events_time ON events USING BRIN (created_at);Check it: Run the slow query with EXPLAIN (ANALYZE, BUFFERS) before and after you add the index. The plan should change from a sequential scan to an index scan, and the buffers read should fall sharply.
Step 3: CTEs and window functions for complex queries
-- Top 3 orders per customer in one pass
SELECT customer_id, id, total_cents
FROM (
    SELECT id, customer_id, total_cents,
           ROW_NUMBER() OVER (PARTITION BY customer_id
                              ORDER BY total_cents DESC) AS rn
    FROM orders
) t
WHERE rn <= 3;

-- Recursive CTE for tree traversal
WITH RECURSIVE subtree AS (
    SELECT id, parent_id, 1 AS depth FROM categories WHERE id = 42
    UNION ALL
    SELECT c.id, c.parent_id, s.depth + 1
    FROM categories c JOIN subtree s ON c.parent_id = s.id
)
SELECT * FROM subtree;
Step 4: Queue tables with SKIP LOCKED
-- Reliable job queue without Kafka or Redis
CREATE TABLE jobs (
    id      bigint GENERATED ALWAYS AS IDENTITY PRIMARY KEY,
    payload jsonb  NOT NULL,
    status  text   NOT NULL DEFAULT 'pending',
    locked_at timestamptz
);

-- Worker pulls one job atomically; concurrent workers don't collide. A job left
-- 'running' by a crashed worker needs a separate sweep based on locked_at.
WITH next AS (
    SELECT id FROM jobs
    WHERE status = 'pending'
    ORDER BY id
    FOR UPDATE SKIP LOCKED
    LIMIT 1
)
UPDATE jobs SET status = 'running', locked_at = now()
WHERE id IN (SELECT id FROM next)
RETURNING *;Check it: Start two workers against the same queue table and insert ten jobs. Each job should be taken by exactly one worker, and neither worker should wait for the other.
Step 5: EF Core 10 with Npgsql
// Program.cs — EF Core 10 with Npgsql 10 (supports JSONB, vectors, ranges)
builder.Services.AddDbContext<AppDb>(opt =>
    opt.UseNpgsql(connStr, o => o.UseVector()));   // pgvector

public class Order
{
    public long Id { get; set; }
    public long CustomerId { get; set; }
    [Column(TypeName = "jsonb")]
    public JsonDocument Items { get; set; } = default!;
}

// LINQ that compiles to JSONB containment
var hits = await db.Orders
    .Where(o => EF.Functions.JsonContains(o.Items, """{"lineItems":[{"sku":"ABC-123"}]}"""))
    .ToListAsync();
Step 6: When a query slows down, read the plan first
EXPLAIN (ANALYZE, BUFFERS, SETTINGS, FORMAT TEXT)
SELECT * FROM orders WHERE customer_id = 42 AND status = 'open';

-- Read these signals:
-- "Seq Scan"          → missing or unused index
-- "Rows Removed"      → predicate not pushed into the index
-- "Heap Fetches"      → index-only scan failing → run VACUUM
-- "Buffers: shared read=N" → cache miss, N pages from diskCheck it: Take your slowest query from pg_stat_statements and read its plan. Find the node where the estimated rows and the actual rows differ most. That's usually where the plan went wrong.
Vacuum, Bloat and the Table That Doubled in Size
Postgres never updates a row in place. An UPDATE writes a new version and marks the old one dead; a DELETEonly marks it dead. Vacuum later reclaims that space for reuse. On a busy table, if vacuum falls behind, dead rows pile up, the table and its indexes grow far beyond the live data, and every scan reads pages full of garbage. That is often the real story behind “the query got slower every month”.
-- Which tables carry the most dead rows, and when were they last vacuumed?
SELECT relname, n_live_tup, n_dead_tup,
       round(100.0 * n_dead_tup / greatest(n_live_tup, 1), 1) AS dead_pct,
       last_autovacuum
FROM pg_stat_user_tables
ORDER BY n_dead_tup DESC
LIMIT 10;
Two causes explain most cases:
- Defaults sized for small tables. Autovacuum triggers when dead rows exceed roughly 20% of the table (
autovacuum_vacuum_scale_factor = 0.2). On a 200-million-row table that is 40 million dead rows before anything happens. Lower it for your largest, busiest tables:ALTER TABLE orders SET (autovacuum_vacuum_scale_factor = 0.02); - Long-running transactions. Vacuum cannot remove a row version that any open transaction might still need. One session left idle in transaction by a crashed worker, or a reporting query that runs for hours, blocks cleanup across the whole database. Set
idle_in_transaction_session_timeout, and alert on the age of the oldest transaction inpg_stat_activity.
Check it: Run the dead-row query above on your largest table. If dead rows are a large share of the live ones, or the last autovacuum was days ago, that table needs settings of its own.
Connections Are Not Free
Every Postgres connection is a separate server process with its own memory. A few hundred are fine; a few thousand, opened by forty application pods each with a pool of fifty, will consume memory and context-switch time long before queries do. Raisingmax_connections makes this worse, not better.
Size it from the other end. A database server does useful work on roughly as many concurrent queries as it has cores, plus some allowance for I/O waits. Keep each application’s pool small (Npgsql pools per connection string by default; setMaximum Pool Size explicitly), and put PgBouncer in transaction pooling mode in front of the database when the number of application instances is large or changes often. Transaction mode used to break prepared statements; PgBouncer 1.21 and later can track them with max_prepared_statements, but session-level features such as advisory locks held across transactions andSET without LOCAL still do not survive it. Check your code for those before switching modes.
Check it: Multiply your application instances by their pool size and compare the result with the cores on the database server. If it's many times larger, the pools are too big.
Mistakes That Slow Production
- VACUUM neglect. MVCC leaves dead tuples; without autovacuum tuning, indexes bloat and queries slow. Watch
pg_stat_user_tables.n_dead_tupand tuneautovacuum_vacuum_scale_factorper table. - Connection storm. Postgres is process-per-connection. Always front it with PgBouncer in transaction-pooling mode for serverless or high-fanout apps.
- SELECT * over the wire. Wide tables with TOASTed JSONB blow your network budget. Project explicit columns.
- OFFSET pagination.
LIMIT 20 OFFSET 100000scans 100020 rows. Use keyset pagination on an indexed column:WHERE id > $cursor ORDER BY id LIMIT 20. - Indexes on every column. Each index slows writes and competes for shared_buffers. Drop unused ones — check
pg_stat_user_indexes.idx_scan = 0. - Long transactions. A single open transaction can stop vacuum removing dead rows across the database. Set
statement_timeoutandidle_in_transaction_session_timeoutin production.
Try It on Your Own System This Week
Three checks on a Postgres database you already run, about an hour in total:
- Turn on pg_stat_statements. Then list your top queries by total time. That's where tuning pays.
- List the indexes that have never been scanned. Each one slows every write for nothing, unless a rare report needs it.
- Find the oldest open transaction. One session left idle in a transaction can stop vacuum across the whole database.
PostgreSQL 18, 19 and What to Do About Them
PostgreSQL 18 is the current stable major version, and PostgreSQL 19 reached its first release candidate on 15 October 2026. Highlights in 18 that matter day to day include asynchronous I/O, uuidv7() and virtual generated columns. Also note that PostgreSQL 14 stops receiving fixes on 12 November 2026, so check your fleet now.
Check These Settings First
Defaults are conservative. Set shared_buffers to about a quarter of RAM, turn on pg_stat_statements, and find your top queries by total time, as that's where tuning pays off. Add log_min_duration_statement so that slow queries get recorded. Use a connection pooler such as PgBouncer, because Postgres connections are expensive, and serverless functions can exhaust them quickly.
What I Would Do First
- JSONB + GIN can replace a separate document store for many use cases.
FOR UPDATE SKIP LOCKEDturns Postgres into a reliable job queue with no extra infrastructure.- Generated columns + partial indexes solve many "I need a denormalized view" problems.
- Use BRIN for time-series and append-only tables, where it's far smaller than a btree.
- PostgreSQL 18 added an asynchronous I/O subsystem, which speeds up sequential scans, vacuum and bitmap heap scans on fast storage. Re-test old assumptions after you upgrade.
EXPLAIN (ANALYZE, BUFFERS)is your only honest performance feedback. Read it before tuning.- PgBouncer is not optional for serverless workloads — Postgres connections are heavy.