
Problem Context
OpenTelemetry is the lingua franca for traces, metrics, and logs. The gen_ai.* semantic conventions extend it specifically for LLM workloads — token counts, costs, model versions, finish reasons, tool calls. Adopting them now means your traces stay portable across Phoenix, Langfuse, Datadog, App Insights, and whatever you migrate to next.
- You have vendor-locked traces in one tool and can't correlate with your APM
- You're hand-rolling span names like
"openai_call_v2"and have 14 variants - You want one trace for the whole request — gateway → retrieval → LLM → tool — but your LLM client doesn't join the trace
The Stack
- SDK —
@opentelemetry/api,opentelemetry-sdk-node,opentelemetry-python. - Instrumentation —
opentelemetry-instrumentation-openai,...-anthropic,...-langchain, plus auto-instrumentation for HTTP/DB. - Collector — the OTel Collector receives OTLP, transforms, and fans out to backends.
- Backend — Phoenix, Langfuse, Tempo, Jaeger, App Insights, Datadog. All consume OTLP.
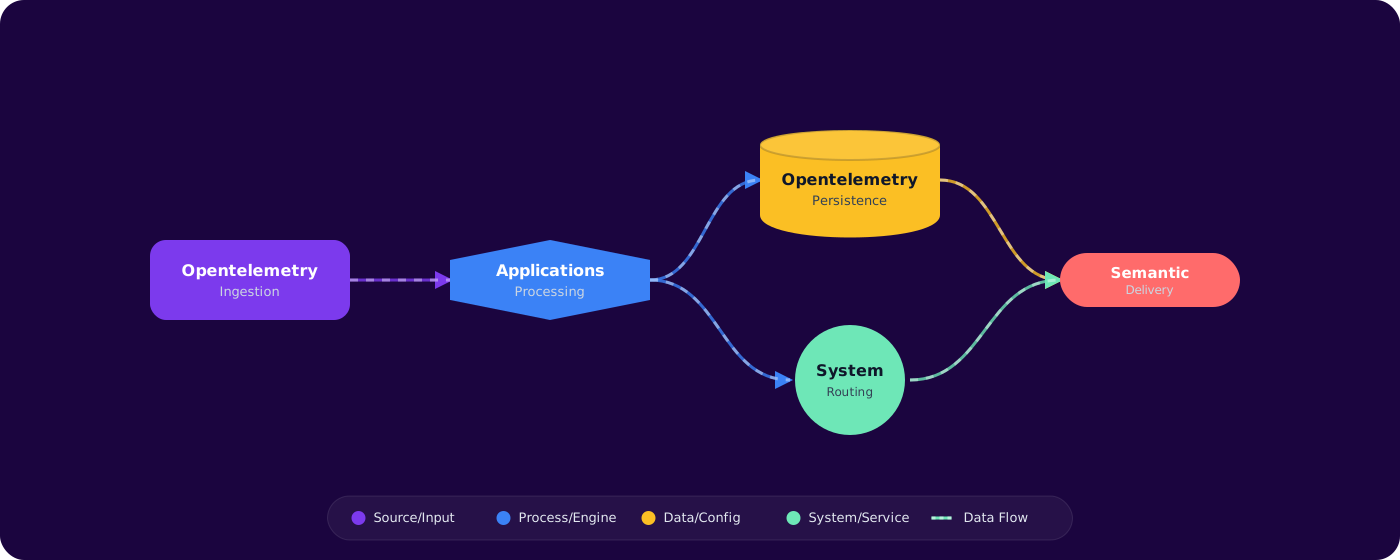
flowchart LR
    APP[App + auto-instrumentation] -->|OTLP/gRPC| C[OTel Collector]
    C --> PH[Phoenix]
    C --> AI[App Insights]
    C --> DD[Datadog]
    C --> SQL[(Long-term store)]
The Conventions You Should Emit
Attributes from the gen_ai semantic conventions (2025+):
gen_ai.system               "openai" | "azure.ai.openai" | "anthropic" | "google.gemini"
gen_ai.operation.name       "chat" | "embeddings" | "completion"
gen_ai.request.model        "gpt-4o-2024-08-06"
gen_ai.request.temperature  0.2
gen_ai.request.max_tokens   1024
gen_ai.response.model       "gpt-4o-2024-08-06"
gen_ai.response.finish_reasons ["stop"]
gen_ai.usage.input_tokens   1248
gen_ai.usage.output_tokens  312
gen_ai.usage.cached_tokens  1024
Add your own under a dedicated namespace (e.g. app.tenant.id, app.prompt.template.id) — don't collide with reserved names.
Minimal Node.js Setup
import { NodeSDK } from '@opentelemetry/sdk-node';
import { OTLPTraceExporter } from '@opentelemetry/exporter-trace-otlp-http';
import { OpenAIInstrumentation } from '@traceloop/instrumentation-openai';
import { getNodeAutoInstrumentations } from '@opentelemetry/auto-instrumentations-node';

const sdk = new NodeSDK({
  serviceName: 'support-agent',
  traceExporter: new OTLPTraceExporter({ url: process.env.OTEL_EXPORTER_OTLP_ENDPOINT }),
  instrumentations: [
    getNodeAutoInstrumentations(),
    new OpenAIInstrumentation({ captureMessageContent: false }), // PII!
  ],
});

await sdk.start();
One Trace, End-to-End
The win is propagation. The HTTP server creates the root span; auto-instrumented Postgres, Redis, and HTTP clients add child spans; the LLM instrumentation adds the gen_ai span. As long as the same trace context flows through (via traceparent headers or async-local storage), you get a single tree from request to response — including the embedding lookup and the tool call.
Capturing Messages — Carefully
Most instrumentations have a captureMessageContent flag. Turning it on records prompts and completions as span events, which makes debugging trivial — and gives you a giant pile of PII. The pragmatic settings:
- Off in production by default.
- On for an internal dogfooding tenant or a feature flag for opted-in users.
- If on, redact: e-mail, phone, card numbers via a Collector processor before storage.
The Collector Is Your Friend
Run the OTel Collector as a sidecar or DaemonSet. It centralises:
- Sampling decisions (tail-based, error-priority).
- Redaction processors (regex over span attributes).
- Cost computation (
tokens × price) injected asgen_ai.cost.usd. - Multi-backend fan-out — switch vendors by editing one YAML.
Failure Modes
- Broken context propagation — async tasks lose the active span. Use the framework's context manager (
context.with, FastAPI middleware) orAsyncLocalStorage. - Cardinality explosions — putting
user.idon a metric attribute kills your metrics backend. Keep high-cardinality on spans, low-cardinality on metrics. - Streaming LLM responses — a span closed at first byte misses the full output. Use the streaming-aware version of the instrumentation.
- Custom span names per call — "openai-call-42" defeats aggregation. Use the operation name (
chat) and let attributes carry the detail.
Production Checklist
- OTel SDK + auto-instrumentation + a GenAI instrumentation per provider you use.
- Collector as sidecar/DaemonSet with redaction + cost processors.
gen_ai.*conventions only — no bespoke attribute names.- Sampling: 100% on error/feedback, tail-based on the rest.
traceparentthreaded through every internal HTTP/queue hop.
Key Takeaways
- OpenTelemetry +
gen_ai.*is the portable choice — pick it before you pick a backend. - The Collector is where you do redaction, sampling, and cost — keep app code dumb.
- One trace from gateway to LLM to tool is the artifact that makes everything else (eval, replay, debug) possible.