
Start With What One Service Can Tell You
If one service makes one model call, its logs and the provider's dashboard tell the whole story, and you don't need a tracing standard yet. That changes when a request passes through a front end, an API, retrieval and a model, because then no single component can tell you what happened.
OpenTelemetry is the lingua franca for traces, metrics, and logs. The gen_ai.* semantic conventions extend it specifically for LLM workloads — token counts, model versions, finish reasons, tool calls. Adopting them now means your traces stay portable across Phoenix, Langfuse, Datadog, App Insights, and whatever you migrate to next.
- You have vendor-locked traces in one tool and can't correlate with your APM
- You're hand-rolling span names like
"openai_call_v2"and have 14 variants - You want one trace for the whole request — gateway → retrieval → LLM → tool — but your LLM client doesn't join the trace
The Stack
- SDK —
@opentelemetry/api,@opentelemetry/sdk-node,opentelemetry-python. - Instrumentation —
@opentelemetry/instrumentation-openaior community packages for other providers and frameworks, plus auto-instrumentation for HTTP/DB. - Collector — the OTel Collector receives OTLP, transforms, and fans out to backends.
- Backend — Phoenix, Langfuse, Tempo, Jaeger, App Insights, Datadog. All can take OpenTelemetry data, directly or through the Collector.
flowchart LR
    APP[App + auto-instrumentation] -->|OTLP/gRPC| C[OTel Collector]
    C --> PH[Phoenix]
    C --> AI[App Insights]
    C --> DD[Datadog]
    C --> SQL[(Long-term store)]
The Conventions You Should Emit
Attributes from the gen_ai semantic conventions:
gen_ai.provider.name        "openai" | "azure.ai.openai" | "anthropic" | "gcp.gemini"
                            (replaces the deprecated gen_ai.system)
gen_ai.operation.name       "chat" | "embeddings" | "execute_tool" | "invoke_agent" | "retrieval"
gen_ai.request.model        "gpt-6.1-sol"
gen_ai.request.temperature  0.2
gen_ai.request.max_tokens   1024
gen_ai.response.model       "gpt-6.1-sol"
gen_ai.response.finish_reasons ["stop"]
gen_ai.usage.input_tokens   1248
gen_ai.usage.output_tokens  312
gen_ai.usage.cache_read.input_tokens  1024   (counted within input_tokens)
Add your own under a dedicated namespace (e.g. app.tenant.id, app.prompt.template.id) — don't collide with reserved names.
Treat these conventions as a moving target. The GenAI conventions are still marked as in development, have moved into their own OpenTelemetry repository, and have renamed attributes more than once: gen_ai.system became gen_ai.provider.name, and the old prompt_tokens and completion_tokens became input_tokens and output_tokens. Pin the instrumentation library versions you use, read the changelog before upgrading, and keep dashboards and alerts on a small set of attributes so a rename means editing a few queries, not rebuilding every panel.
Check it: Look at one model span in your backend and compare its attribute names with the current conventions. Then check that your dashboards read only a small set of them, so that a rename costs a few edits.
Minimal Node.js Setup
import { NodeSDK } from '@opentelemetry/sdk-node';
import { OTLPTraceExporter } from '@opentelemetry/exporter-trace-otlp-http';
import { OpenAIInstrumentation } from '@opentelemetry/instrumentation-openai';
import { getNodeAutoInstrumentations } from '@opentelemetry/auto-instrumentations-node';

const sdk = new NodeSDK({
  serviceName: 'support-agent',
  traceExporter: new OTLPTraceExporter({ url: process.env.OTEL_EXPORTER_OTLP_ENDPOINT }),
  instrumentations: [
    getNodeAutoInstrumentations(),
    new OpenAIInstrumentation({ captureMessageContent: false }), // PII!
  ],
});

sdk.start();
One Trace, End-to-End
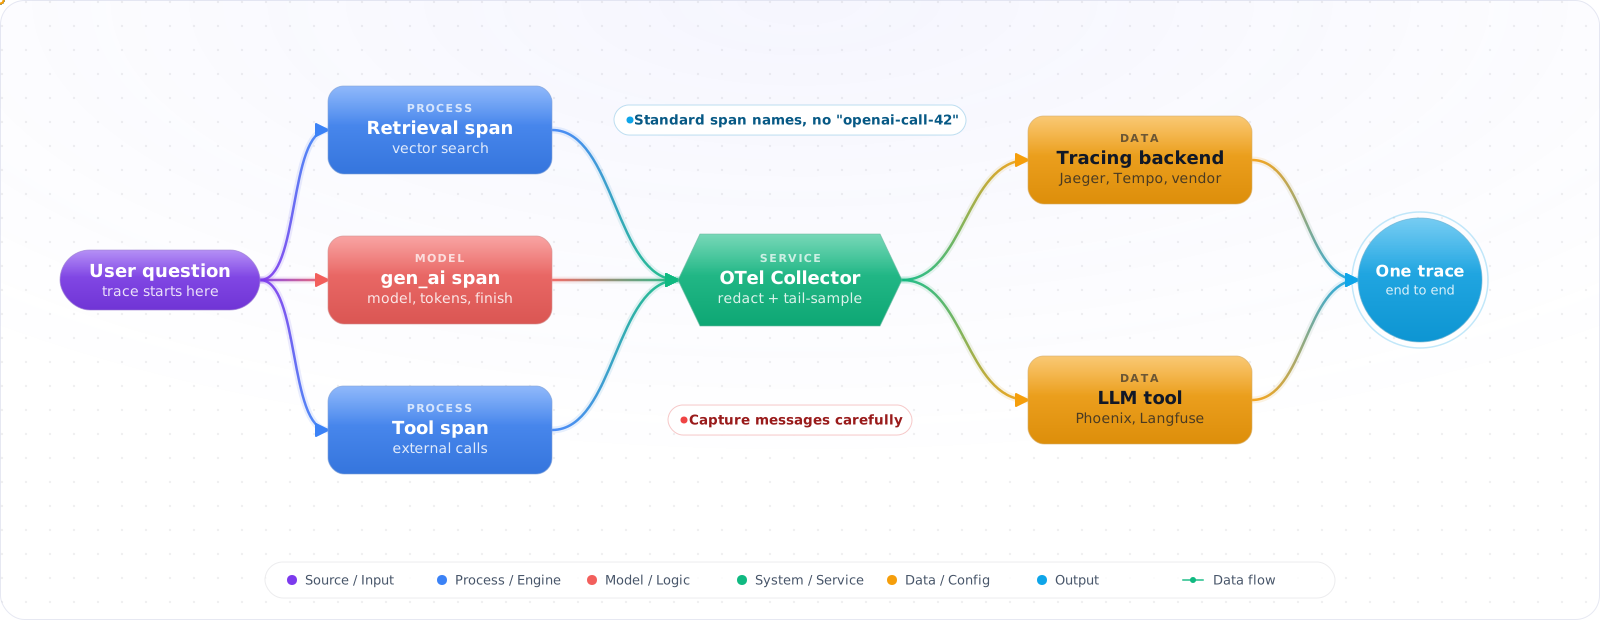
The win is propagation. The HTTP server creates the root span; auto-instrumented Postgres, Redis, and HTTP clients add child spans; the LLM instrumentation adds the gen_ai span. As long as the same trace context flows through (via traceparent headers or async-local storage), you get a single tree from request to response — including the embedding lookup and the tool call.
Check it: Send one request and open its trace. The HTTP span, the database or retrieval span and the model span should all hang off the same root. A model call that appears as a trace of its own has lost its context somewhere.
Capturing Messages — Carefully
Most instrumentations have a captureMessageContent flag. Turning it on records prompts and completions as span events, which makes debugging trivial — and gives you a giant pile of PII. The pragmatic settings:
- Off in production by default.
- On for an internal dogfooding tenant or a feature flag for opted-in users.
- If on, redact: e-mail, phone, card numbers via a Collector processor before storage.
Check it: Send a request containing a made-up email address and card number, then search your trace backend for them. Neither should be there.
The Collector Is Your Friend
Run the OTel Collector as a sidecar or DaemonSet. It centralises:
- Sampling decisions (tail-based, error-priority).
- Redaction processors (regex over span attributes).
- Cost computation (
tokens × price) injected asapp.cost.usd(your namespace: cost is not part of the conventions). - Multi-backend fan-out — switch vendors by editing one YAML.
Check it: Point the collector at a second backend by changing its configuration only. Traces should arrive in both, with no change to application code.
Tracing Agents, Not Just Model Calls
A single chat completion is easy to trace. An agent that plans, calls four tools, retries one of them and calls the model six times is where tracing earns its keep, and where flat logs become unreadable. Shape the trace so it mirrors what the agent did:
invoke_agent support-agent                  4.8s
├── chat gpt-6.1-sol                        0.9s   (plan)
├── execute_tool search_orders              0.3s
├── chat gpt-6.1-sol                        0.7s
├── execute_tool issue_credit               1.2s   status=ERROR  (retried)
├── execute_tool issue_credit               0.4s
└── chat gpt-6.1-sol                        1.1s   (final answer)
Use the conventions’ operation names for the span types (invoke_agent, chat,execute_tool) and put the tool name on the tool span. Record tool arguments only when they are safe to store, applying the same rules as message content. With this shape, “why did that answer take five seconds?” is answered by looking at one trace, and “which tool fails most?” becomes a query over span status grouped by tool name.
Linking Traces to Quality
Latency and token counts tell you how the system ran, not whether the answer was any good. Close that gap by attaching quality signals to trace IDs. Return the trace ID to the client with the response; when the user clicks thumbs down, the feedback event carries that ID. Do the same with scores from online evaluations. Then configure tail sampling to keep every trace that received feedback or a low score, so the conversations you most need to investigate are always available in full, while routine successful traffic is sampled down.
Failure Modes
- Broken context propagation — async tasks lose the active span. Use the framework's context manager (
context.with, FastAPI middleware) orAsyncLocalStorage. - Cardinality explosions — putting
user.idon a metric attribute kills your metrics backend. Keep high-cardinality on spans, low-cardinality on metrics. - Streaming LLM responses — a span closed at first byte misses the full output. Use the streaming-aware version of the instrumentation.
- Custom span names per call — "openai-call-42" defeats aggregation. Use the operation name (
chat) and let attributes carry the detail.
Try It on Your Own System This Week
Three checks on a system that already emits some telemetry, about an hour in total:
- Follow one request across every component. Count the tools you had to open. More than one means the trace context is being dropped.
- List your span names for model calls. If there's more than one name for the same operation, use the convention's name and put the detail in attributes.
- Search your traces for an email address. If you find one, turn content capture off or add redaction before storage.
Production Checklist
- OTel SDK + auto-instrumentation + a GenAI instrumentation per provider you use.
- Collector as sidecar/DaemonSet with redaction + cost processors.
- Standard
gen_ai.*attributes for model calls; anything custom goes underapp.*, never insidegen_ai.*. - Sampling: 100% on error/feedback, tail-based on the rest.
traceparentthreaded through every internal HTTP/queue hop.
The State of the Conventions
The GenAI conventions moved into their own repository, semantic-conventions-genai, and their status is still Development, with no release yet. So plan for names to change. Keep the mapping in one wrapper, pin your instrumentation versions, and treat a schema change as a migration. Google's ADK 2.13 moved its default to a newer schema and removed a span name, which is exactly the kind of change that makes a dashboard go flat.
The conventions now cover more than model calls. There are agent operations such as create_agent, invoke_agent and execute_tool, and separate MCP conventions, with trace context carried in _meta. The agent observability topic works through a full example.
Key Takeaways
- OpenTelemetry +
gen_ai.*is the portable choice — pick it before you pick a backend. - The Collector is where you do redaction, sampling, and cost — keep app code dumb.
- One trace from gateway to LLM to tool is the artifact that makes everything else (eval, replay, debug) possible.